Spectra Tech employes sophisticated equipment and software to test and document the Assumed (ASTC) or Field (FSTC) Sound Transmission Class ratings of demising interior elements of construction, including walls, doors, floor / ceiling assemblies, cubicles, and glass, in strict accordance with the most up-to-date version of ASTM Standard E336.
Since 1989, our staff has conducted hundreds of FSTC tests. When unexpected performance deficiencies arise, We can provide on-the-spot guidance on how these deficiencies might be corrected through adjustment of door seals, additional caulking, or by whatever means necessary to achieve the targeted performance goal. When you contract with Spectra Tech for ASTC/FSTC testing, you get the services of top industry professionals who understand what you really need to get the job done..
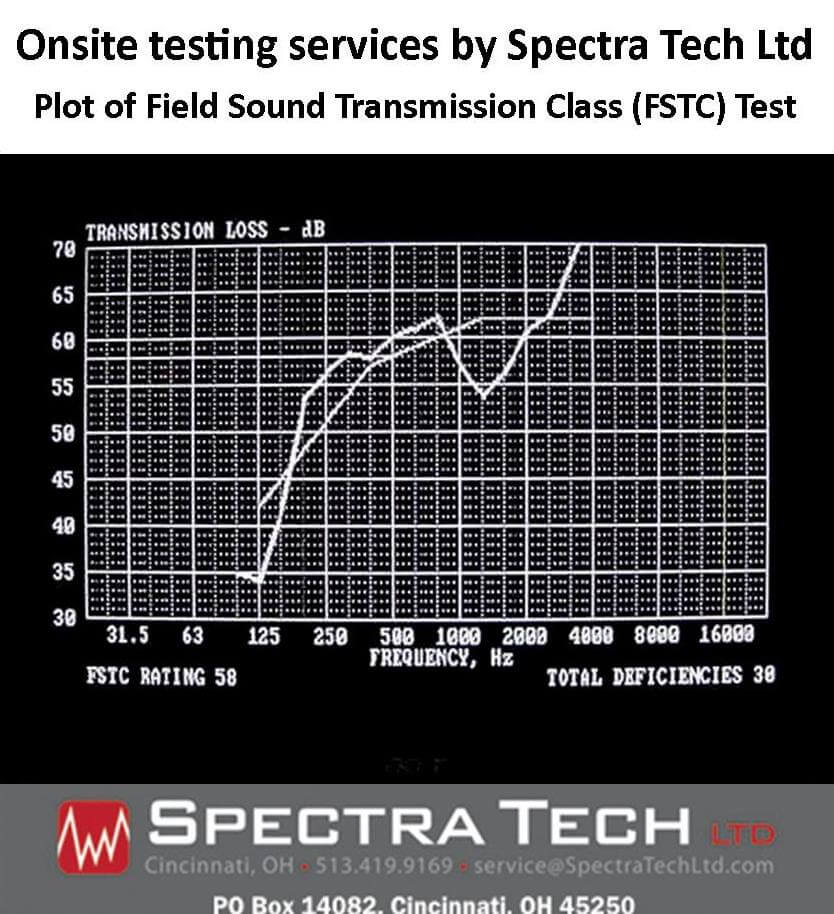
- The Transmission Loss (TL) Class Curves were developed to form a universal standard by whichthe noise reduction provided by various building materials and design configuraations could be quantified.
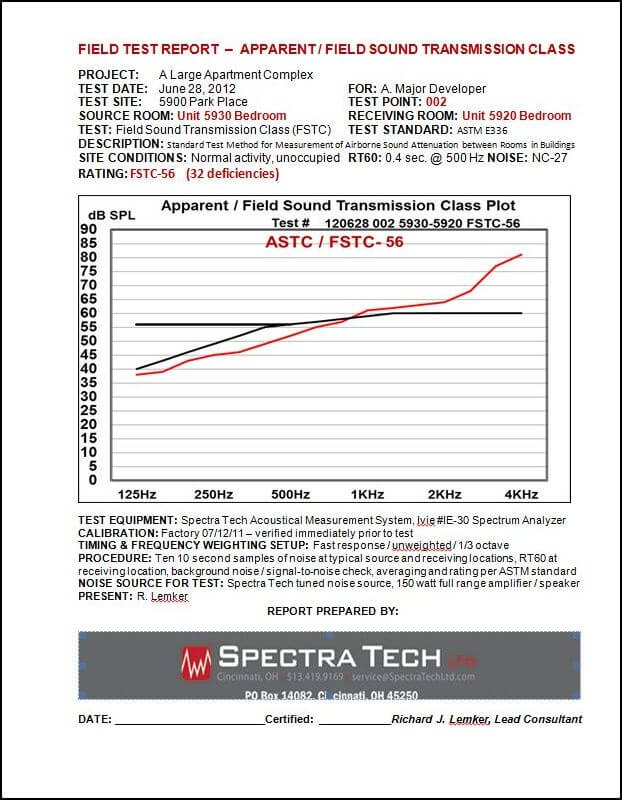
- To test the transmission of sound through a particular construction, a broadband spectrum of noise is generated at all frequencies between 63 Hz and 8,000 Hz and amplified to provide a level at the receiving side that is sufficiently higher than the room’s normal ambient noise level.
- The average unweighted (fast response) sound levels for each octave frequency band between 125 Hz and 4,000 Hz (4KHz) is recorded at ten random locations on the “source side” of the construction for a period of 10 seconds or more.
- Then, the average unweighted (fast response) sound levels for each octave frequency band between 125 Hz and 4,000 Hz (4KHz) is recorded at ten random locations on the “receiving side” of the construction for a period of 10 seconds or more.
Spectra Tech Ltd, data logging computer system, on-site field test - The test results are plotted over a family of reference curves, and computations are made to allow for a maximum of 8 dB of deficiencies in any octave band or up to a total of 32 dB of deficiencies in all octave bands combined. The corresponding value of the plot at 500 Hz is the NIC value.
- Plot / Print Test Results: We can provide documentation of test results by plotting / printing the test values on paper, and / or provide the reslts in PDF format.
LINKS TO RELATED REFERENCE INFORMATION